 discoDSP has updated Scope Visualizer to v1.4.
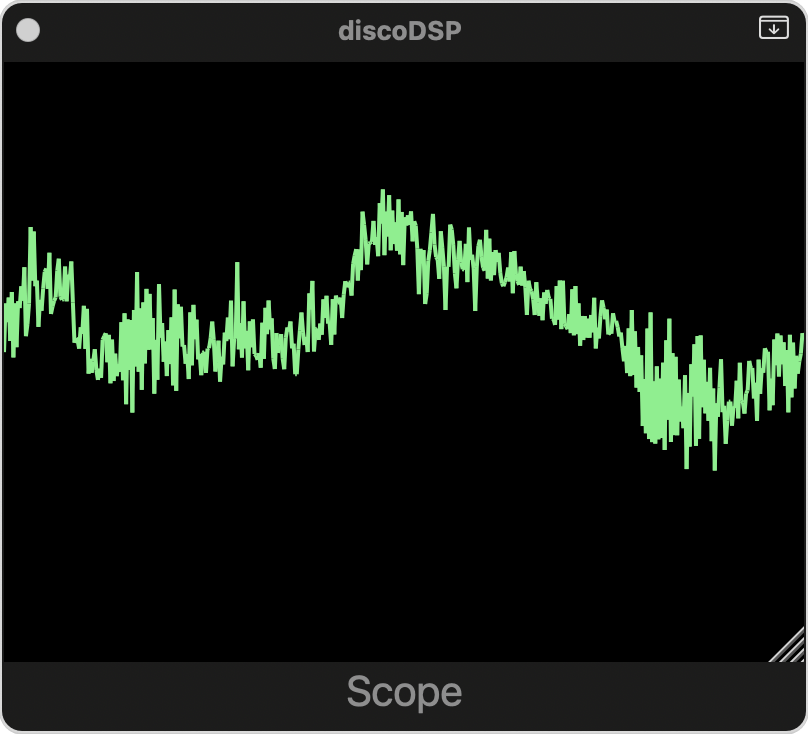
Scope uses a two-axis graph to give a visual representation of a waveform over time, with the horizontal axis representing time and the vertical axis representing the amplitude.
Here's what's new:
- Now accommodates stereo inputs, fusing these signals into a singular, streamlined oscilloscope waveform, thereby enhancing the visualization process.
- Refined touch interactions; a simple tap on the screen will now display volume indicator lines at -6dB, -3dB, and 0dB.
- Improved the plugin builds to remember its window size, ensuring consistent dimensions across different sessions.
Update to the iOS version is also available at Apple App Store.