What does a waveform represent at a very fine-grained level?

Official support for: bitwig.com
Post Reply New Topic
RELATED
PRODUCTS

Post

In the "Edit" panel layout, if an audio track is opened, I can see its waveform. If I zoom in really hard, to milliseconds and even tenths of milliseconds, I can still see it:
Image

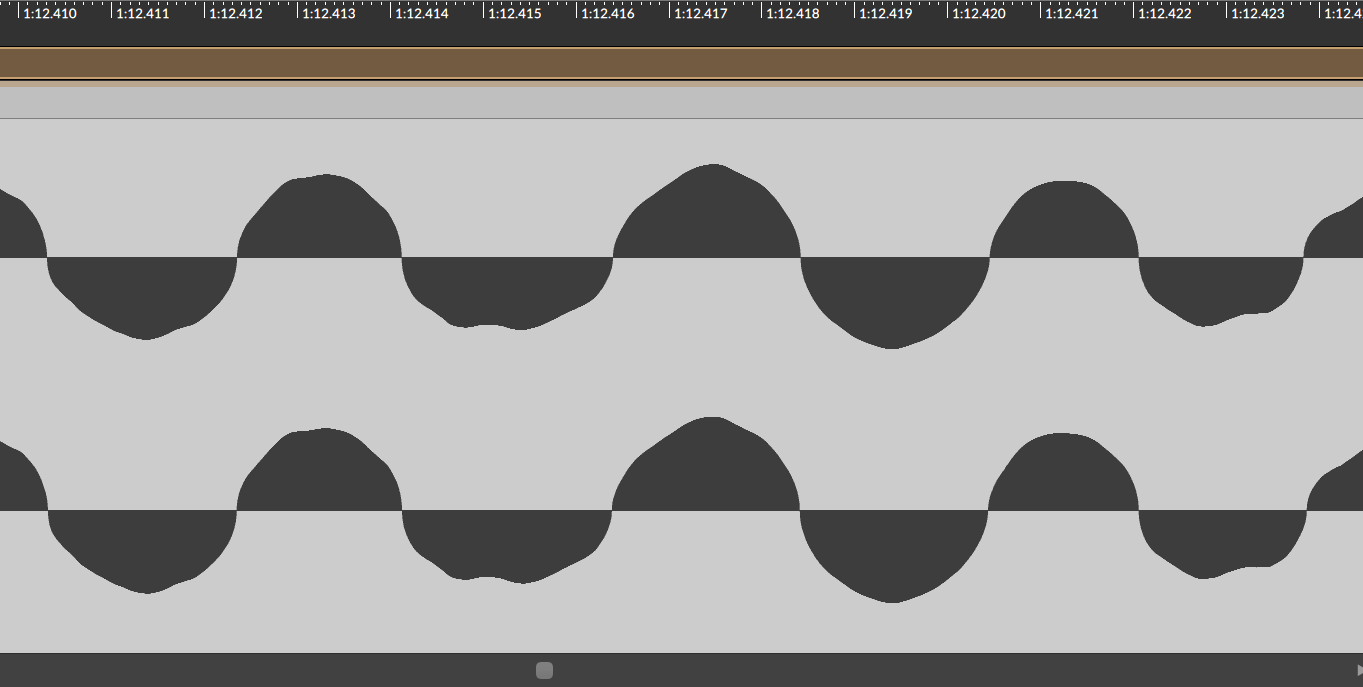
My question is - what exactly am I seeing here? Is this an actual plot of changes in air pressure? (If yes, then that's very cool) Or is it something else? If it is the actual air pressure change, what can I use it for? Right now I'm editing some audio track and I want to copy a section and insert it multiple times. Should I somehow use this very fine-grained plot to do that? Should I try to make the cuts in places with approximately the same pressure change, or something like that?

Btw, why are there two plots? Are those the L and R channels or is it something else?

Post

yep its changes in air pressure/sound volume. Generally cut at zero crossings (in the middle). If you do this right you can make seamless loops with no crossfading. I think youre also right that there are 2 for left and right channels. You can use this to compare your tracks' waveform to a record. You can also see things like peaks/transients as steep slopes. steeper slopes = more high frequency harmonics. try a wavetable synth like serum and mess around with making different waveforms.

Post Reply

Return to “Bitwig”