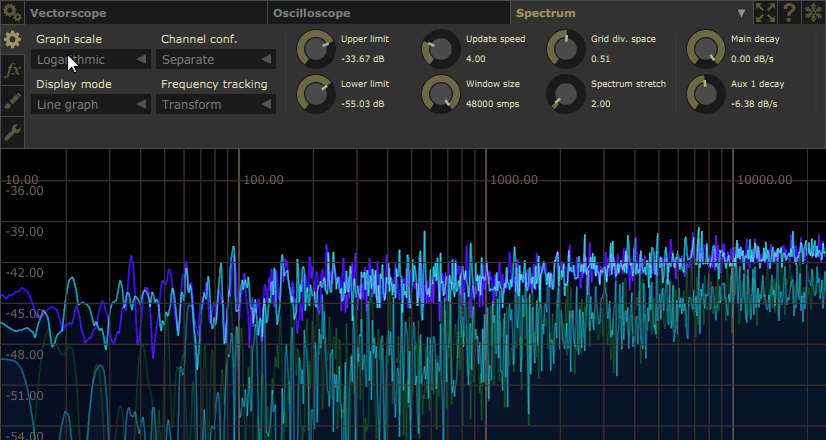
I was playing a bit with the spectrum analyzer, and it looks like it has a +1dB/oct slope: feeding a white noise to it, I get it to be flat with about -1dB/oct slope, and with a pink noise I need +2dB/oct. I used the JSFX generators that come with Reaper, and they look accurate when measured with other spectrum analyzers.
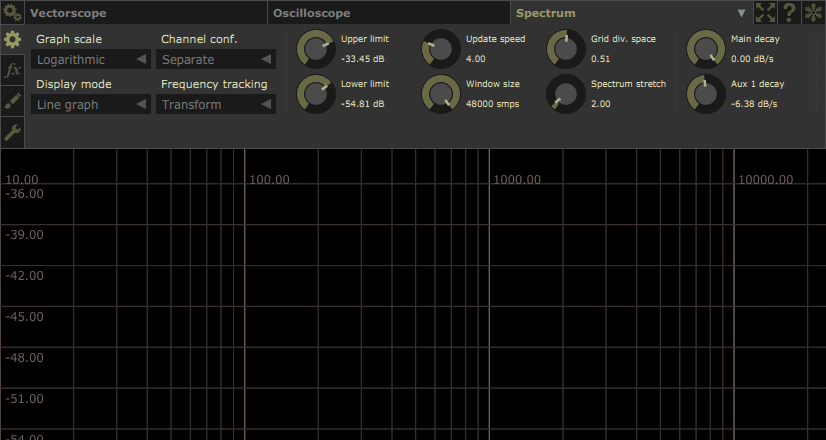
Also, it has a ton of parameters, but it looks like there's no configurable FFT block size, or did I miss it?