I know, but...the problem is that among hundrets of unneeded /to me/ features to pay for theres still one feature which seems missing - exactly the feature Im searchingJax Pok wrote:The thing with DMG Audio plugins is they cram in hundreds of features that you don't get in other plugins so they charge a price related to how much work they put in. The more of their plugins you own the more you get a discount on the ones you don't own.

precise stereo correlation analyzer plugin-does it exist??
-
- KVRian
- Topic Starter
- 1099 posts since 30 Oct, 2005
-
- Banned
- 22457 posts since 5 Sep, 2001
i actually don't think it exists then. I mean i have looked at everything.. the dmg was the only one that even registered.
Sorry seems you are out of luck, but also have a decent idea to present for development.
Sorry seems you are out of luck, but also have a decent idea to present for development.
-
- KVRAF
- 2448 posts since 12 Sep, 2004
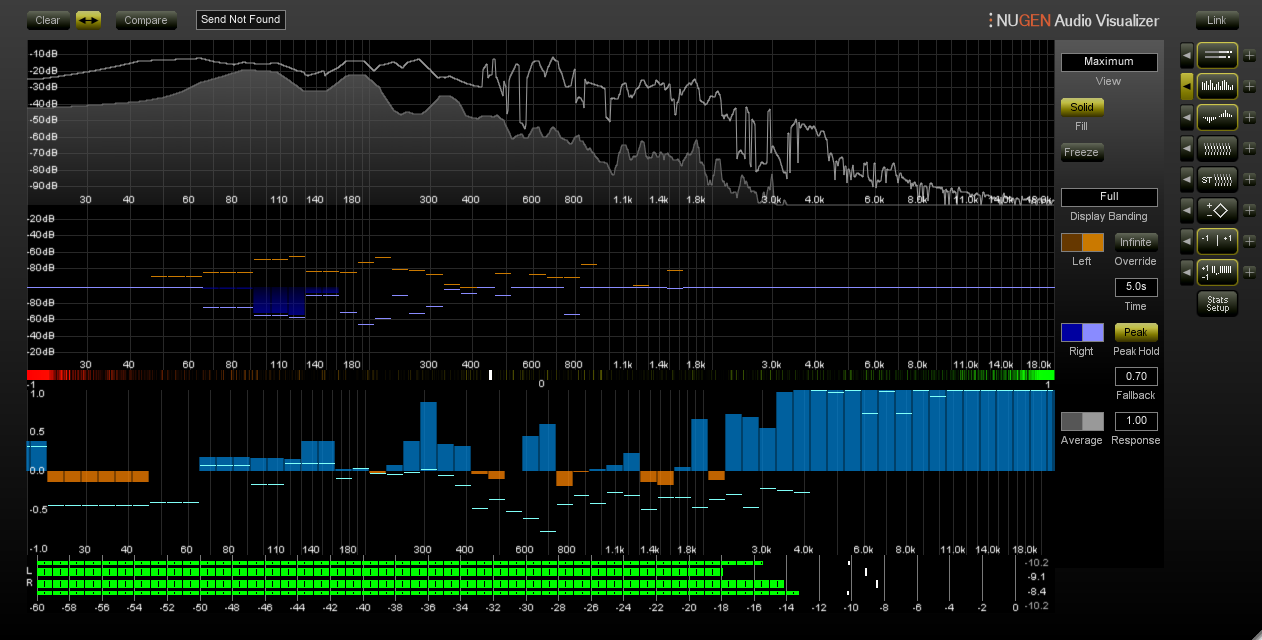
Nugen Visualizer has correlation by frequency. Page 16 in the manual shows a spectrogram over time with individual correclation markers. http://www.nugenaudio.com/files/manuals ... manual.pdf
If that's not correlation by frequency then I can't imagine what is being asked for.
If that's not correlation by frequency then I can't imagine what is being asked for.
You need to limit that rez, bro.
-
- KVRian
- Topic Starter
- 1099 posts since 30 Oct, 2005
kbaccki, where on that page 16 do you see any hint of exact phase dependant frequency FFT-like plot?kbaccki wrote:Nugen Visualizer has correlation by frequency. Page 16 in the manual shows a spectrogram over time with individual correclation markers. http://www.nugenaudio.com/files/manuals ... manual.pdf
all I CAN see on page 16 is only the most basic overall correlation meter /=common for ALL frequencies/ underlayed by spectrogram and displayed over time, which can be eventually freezed, so this is not what I would call precise correlation by frequency...rather I would call it basic correlation over time
imagine you want precise frequency analyzer and all you got is something which shows you only ONE dominant frequency over time...how happy you will bekbaccki wrote: If that's not correlation by frequency then I can't imagine what is being asked for.
-
- KVRAF
- 2448 posts since 12 Sep, 2004
I see, you don't want correlation weighted by frequency, you want a correlation value per frequency... My bad. Hm, that would be a pricey CPU hit. 
Agree, could be a very useful tool..
Agree, could be a very useful tool..
You need to limit that rez, bro.


-
- KVRAF
- 2448 posts since 12 Sep, 2004
Ooh ooh ooh... just came across this from google search... guy referring to feature of Nugen Visualizer:
http://forum.renoise.com/index.php/topi ... rrelation/
http://forum.renoise.com/index.php/topi ... rrelation/
You need to limit that rez, bro.
-
- Banned
- 22457 posts since 5 Sep, 2001
i think the problem is that it shows it in db like dualism, and the OP wants to see it in degrees of phase
-
- KVRAF
- 2448 posts since 12 Sep, 2004
The orange and blue bars are -1, 0, 1 correlation per-frequency. Correlation vertical, frequency horizontal.TheoM wrote:i think the problem is that it shows it in db like dualism, and the OP wants to see it in degrees of phase
That image also shows standard frequency, and looks like left/right peak (?) per frequency... but the 3rd is correlation per frequency.
You need to limit that rez, bro.
-
- Banned
- 22457 posts since 5 Sep, 2001
ok but that's still not fine enough.. he already has pha 979 from voxengo for that exact thing. Nice to know visualiser two is so versatile though, did they ever update that thing to 64 bit?
-
- KVRAF
- 2448 posts since 12 Sep, 2004
Yes, v2 is 64bit. Been on my long-term wishlist actually, this thread has rekindled that flame. Kinda.
So you can zoom in to single Hz on that correlation meter, if that helps. In the kHz range it only displays 2 decimal points, so you need to count the fractions yourself... 1.360, 1.361, 1.362, etc. all show as 1.36.
So you can zoom in to single Hz on that correlation meter, if that helps. In the kHz range it only displays 2 decimal points, so you need to count the fractions yourself... 1.360, 1.361, 1.362, etc. all show as 1.36.
You do not have the required permissions to view the files attached to this post.
You need to limit that rez, bro.
-
- KVRian
- Topic Starter
- 1099 posts since 30 Oct, 2005
hmm, many thanks for your effort, overlooked that zoom possibility...kbaccki wrote:Yes, v2 is 64bit. Been on my long-term wishlist actually, this thread has rekindled that flame. Kinda.
So you can zoom in to single Hz on that correlation meter, if that helps. In the kHz range it only displays 2 decimal points, so you need to count the fractions yourself... 1.360, 1.361, 1.362, etc. all show as 1.36.
so now these pictures looks much more promising...definitely it seems like a bit more precise version of Voxengo Correlometer, and since majority of phase problems happen in lower frequencies maybe I can tolerate that bad precision in kHz range
I need to investigate further...
now theres only a need to wait if somebody invent something like spectral delay to easily repair found antiphase frequencies
so far Im doing it manually which is very time consuming work /using steep notch filter-extract problematic frequency-use delay or phase reversal on second channel-add problematic frequency back/
Last edited by kvaca on Mon Jan 11, 2016 4:17 pm, edited 1 time in total.
-
- KVRist
- 75 posts since 31 Jan, 2006
-
- KVRian
- Topic Starter
- 1099 posts since 30 Oct, 2005
I know, but its for mix only...and useless for repairing badly recorded stereo samplesjavahut wrote:http://www.soundradix.com/products/pi/
and that Pi correlometer looks basicaly the same as in Voxengo PHA plugin=is not precise enough...and its a question how efficient the whole plugin is when mixing "if" it is based on that very inaccurate correlometer
moreover there is no clear description how does Pi actually manipulate with phase so I prefer to stay away with such plugins...
-
- KVRAF
- 2448 posts since 12 Sep, 2004
The actual resolution is down to 1 Hz it's just that the display will only show up to 2 decimal places. So instead of 1.360, 1.361 etc. you'll see individual Hz askvaca wrote:since majority of phase problems happen in lower frequencies maybe I can tolerate that bad precision in kHz range
1.36kHz 1.36kHz 1.36kHz 1.36kHz ... 1.37kHz
I'm assuming the smooth intervals are actually calculated or curve-fit, not just averaged over 10Hz or whatever windows. It looks like a curve fit of some sort with control points at single Hz to make it contiguous.
I took a quick look at Sony SpectraLayers product page, didn't see anything but would be surprised if a tool that comprehensive doesn't do what you want.I mean it's a dedicated spectral editor.now theres only a need to wait if somebody invent something like spectral delay to easily repair found antiphase frequencies
You need to limit that rez, bro.