Signalizer: Sidechaining update! Open-source & free audio visualization plugin (v. 0.4.3)

VST, AU, AAX, CLAP, etc. Plugin Virtual Effects Discussion
Post Reply New Topic
RELATED
PRODUCTS

Post

Does Signalizer oscilloscope work as of today, or is it just not implemented yet?
It is not working for me, and it is the most sought after feature that I am looking for.

If it has not yet, I would suggest the following:

-Automatic Syncronization to the period of the incoming signal to stabilize the plot of periodic waveforms.
-Allow for visualization of the Left and Right input channels at the same time: this could be implemented by assigning different colors to the Left and Right channels waveforms.

-As for the Spectrum, there could be an option to select different scale views: Linear or Logarithmic, as well as adding the respective grid lines conforming to this scales. Also in the Logarithmic scale there could be at the bottom a little Piano to have a reference for pitch notes, or a small tool tip indicating the Pitch and frequency while hovering with the mouse over the spectrum.

-The vertical db scale, could also offer the option to be configured: Upper Limit, and Lower Limit.
The meaning of the db lines: e.g. -6 db reduction per grid line.


The plugin world needs a slick Oscilloscope, and I believe this will be the one we've been waiting for :)

Post

dont think its implemented yet

Post

marioisaac wrote:Does Signalizer oscilloscope work as of today, or is it just not implemented yet?
It is not working for me, and it is the most sought after feature that I am looking for.
It's still in development.
-Automatic Syncronization to the period of the incoming signal to stabilize the plot of periodic waveforms.
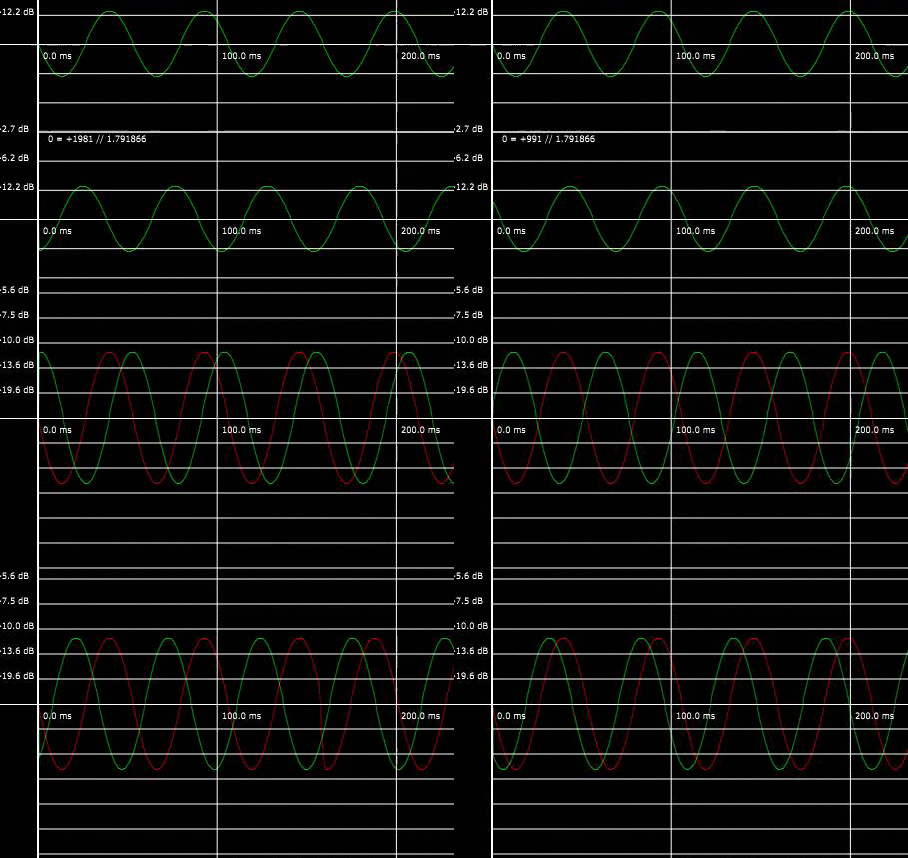
-Allow for visualization of the Left and Right input channels at the same time: this could be implemented by assigning different colors to the Left and Right channels waveforms.
Yeah, basically like this right (old version of the oscilloscope):
Image
-As for the Spectrum, there could be an option to select different scale views: Linear or Logarithmic, as well as adding the respective grid lines conforming to this scales.
This is possible, I'm suspecting you're just using a preset with no grid line colour - this can be set in the colours panel.
Also in the Logarithmic scale there could be at the bottom a little Piano to have a reference for pitch notes, or a small tool tip indicating the Pitch and frequency while hovering with the mouse over the spectrum.
Try using the 'frequency tracking' feature, it probably does what you want. Alternatively, navigate to the presets of the spectrum and activate the 'analytical' one.
-The vertical db scale, could also offer the option to be configured: Upper Limit, and Lower Limit.
The meaning of the db lines: e.g. -6 db reduction per grid line.
Again, this is natively supported - even has assigned controls called upper- and lower limit. You can also shift+scroll in the view to scale, or drag to translate.

Post

Hey Mayae, I finally got around creating a preset for you what's happening on my end once I reload the host.


Basically... I loaded the plugin into any slot, load my preset, save the project, close the host and project. Then I relaunch the host and therefore Signalizer (it's being recalled) and all my settings are gone.

See the attachment
presets_host_reload_bug.zip
You do not have the required permissions to view the files attached to this post.
[ Mix Challenge ] | [ Studio Page / Twitter ] | [ KVRmarks (see: metering tools) ]

Post

Mayae you are amazing. Thank you for your reply.

·That Oscilloscope looks great.

·I found the Grid Lines and noticed the following:

/There were some colors that looked great for the Grid Lines, but the dB numbers as you go up in the scale started to fade away until they disappeared about half the way up. Also the frequency tracking information disappeared.

/The refresh rate of the graph slowed down considerably when adding grid lines (I should say in a good way). The problem I found by adding the grid line, is that the refresh rate seemed to be jiggering constantly in an erratic manner finally rendering a confusing graph. (I also played around with the Windows Size and the Update Rate parameters and could not find the sweet spot I was looking for the refresh rate of the graph.

·The Frequency Tracking feature offered more than what I was looking for in a good way. I would suggest the following:
/The refresh rate of the Delta values are too fast to grasp information from them: this could be slowed down.
/The background of the square could be more transparent in order to interfere as less as possible between the graph and my eyes. Better still, this information could be located along the top edge of the graph. Alternatively it could also be located at the left bottom of the graph where it won´t interfere as much with the graph display.

/The frequency tracking information could change by just hovering the mouse over the graph. I think these would be better as a default behavior, and if one desires to select a point in the graph as it happened right now (Alt/Command + Left click could do the trick). Then a single click anywhere in the graph could revert back to the hovering analysis situation.

·As for the visualization of the graph itself an option could be implemented to let users choose between a filled display and not filled (only showing the top line that represents the values of the graph)

-The vertical db scale, could also offer the option to be configured: Upper Limit, and Lower Limit.
The meaning of the db lines: e.g. -6 db reduction per grid line.
Again, this is natively supported - even has assigned controls called upper- and lower limit. You can also shift+scroll in the view to scale, or drag to translate.
This is better than I wished it to be :clap:


First attempt to load presets Ableton Live 8 Crashed. After that I tried to open presets both in AU/VST format of the Signalizer v. 0.2.7 and this image appeared.
Image
Image
Last edited by marioisaac on Wed Jun 22, 2016 5:11 pm, edited 1 time in total.

Post

marioisaac wrote:Mayae you are amazing. Thank you for your reply.

·That Oscilloscope looks great.

·I found the Grid Lines and noticed the following:

/There were some colors that looked great for the Grid Lines, but the dB numbers as you go up in the scale started to fade away until they disappeared about half the way up. Also the frequency tracking information disappeared.

/The refresh rate of the graph slowed down considerably when adding grid lines (I should say in a good way). The problem I found by adding the grid line, is that the refresh rate seemed to be jiggering constantly in an erratic manner finally rendering a confusing graph. (I also played around with the Windows Size and the Update Rate parameters and could not find the sweet spot I was looking for the refresh rate of the graph.

·The Frequency Tracking feature offered more than what I was looking for in a good way. I would suggest the following:
/The refresh rate of the Delta values are too fast to grasp information from them: this could be slowed down.
/The background of the square could be more transparent in order to interfere as less as possible between the graph and my eyes. Better still, this information could be located along the top edge of the graph. Alternatively it could also be located at the left bottom of the graph where it won´t interfere as much with the graph display.

/The frequency tracking information could change by just hovering the mouse over the graph. I think these would be better as a default behavior, and if one desires to select a point in the graph as it happened right now (Alt/Command + Left click could do the trick). Then a single click anywhere in the graph could revert back to the hovering analysis situation.

·As for the visualization of the graph itself an option could be implemented to let users choose between a filled display and not filled (only showing the top line that represents the values of the graph)
-The vertical db scale, could also offer the option to be configured: Upper Limit, and Lower Limit.
The meaning of the db lines: e.g. -6 db reduction per grid line.
Again, this is natively supported - even has assigned controls called upper- and lower limit. You can also shift+scroll in the view to scale, or drag to translate.
This is better than I wished it to be :clap:


First attempt to load presets Ableton Live 8 Crashed. After that I tried to open presets both in AU/VST format of the Signalizer v. 0.2.7 and this image appeared.
Image
Image

Post

larsomat wrote: ...
Oscarizer is not too bad in that regard, but the generated waveform doesn't have a high enough resolution. Or maybe the resolution is high enough, but it somehow looks strange. s(M)exoscope is much better in that regard, or the oscilloscopes in cableguys software (but those don't have a high enough contrast).

Edit: Here is a comparision of the two, 4/16th notes of kickbass pattern. The information both give is indeed the same, but the cableguys waveform looks like a continous wave. Oscarizor has those weird areas where the wave is not painted continously. That is irritating to my eyes.

And the colors... ouch!
Sorry for warming this up but I just found this post. Oscarizor has a small amount of built-in smoothing activated in the free version by default - that's why it looks "strange". This can be turned off easily in the Pro version with the Smooth control. But of course I could do this by default in the free version.

BTW the colors can now be changed in the recently released free version 2.5.
Sugar Audio - Sweetest Audio Plugins
http://www.sugaraudio.com

Post

Ahoy-hoy!!

Glad to report that the bugs of old are gone for me. No more lagging - I've been using it now for about .5 hr and its not slowing anything down - works just fine this 0.2.7 does.
Cpu usage is about 4-5% on my FX-8350.

It's working great!!!!

Post

Some news?

Post

indeed. would be nice...
regards,
brok landers
BIGTONEsounddesign
gear is as good as the innovation behind it-the man

Post

I got Access Denied error so I can't get v0.2.8 from here. Where can I get a latest one?

https://bitbucket.org/Mayae/signalizer/downloads

Post

Hello all, sorry for the silence.
goleat wrote:Some news?
brok landers wrote:indeed. would be nice...
Yes, version 0.2.9 have been released here. Release notes are here (you can subscribe to not miss updates here). Full release log is here.
Compyfox wrote:Hey Mayae, I finally got around creating a preset for you what's happening on my end once I reload the host.
Basically... I loaded the plugin into any slot, load my preset, save the project, close the host and project. Then I relaunch the host and therefore Signalizer (it's being recalled) and all my settings are gone.
I tested your files, but I cannot reproduce your problem. I checked the contents as well, and it is normal. I'm not sure what the problem could be, sadly. Perhaps test the new version that has a bit different preset system.
marioisaac wrote:There were some colors that looked great for the Grid Lines, but the dB numbers as you go up in the scale started to fade away until they disappeared about half the way up. Also the frequency tracking information disappeared.
That is, when you change the colour?
The refresh rate of the graph slowed down considerably when adding grid lines (I should say in a good way). The problem I found by adding the grid line, is that the refresh rate seemed to be jiggering constantly in an erratic manner finally rendering a confusing graph. (I also played around with the Windows Size and the Update Rate parameters and could not find the sweet spot I was looking for the refresh rate of the graph.
This seems weird, are you able to produce a video of the problem? (You can use QuickTime's built-in screen capture). Also check that changing swap interval to something else than 1 doesn't help.
The refresh rate of the Delta values are too fast to grasp information from them: this could be slowed down.
I'm aware of this, and I'm working on a solution.
The background of the square could be more transparent in order to interfere as less as possible between the graph and my eyes.
You can change the transparency of the background colour to get this effect.
As for the visualization of the graph itself an option could be implemented to let users choose between a filled display and not filled (only showing the top line that represents the values of the graph)
This can be done by changing the "Flood fill" parameter in the bottom wrench tab in the spectrum.
First attempt to load presets Ableton Live 8 Crashed. After that I tried to open presets both in AU/VST format of the Signalizer v. 0.2.7 and this image appeared.
The presets are "encoded" with their supported target. Ie. presets called "xxxx.main.sgn" should only be loaded in the main interface. Presets called "xxxx.vectorscope.sgn" should only be loaded from inside the vectorscope. In your image you're trying to load a preset for the vectorscope part into the whole program, as the info box informs you about. I'm aware that this system isn't the best, however it is only on Mac OS X you even have the possibility to do so; Windows automatically protects you from this situation. If in doubt, only select presets from the drop-down menu in Signalizer.
Uplay wrote:I got Access Denied error so I can't get v0.2.8 from here. Where can I get a latest one?
<span class="skimlinks-unlinked">https://bitbucket.org/Mayae/signalizer/downloads</span>
Try again now. I'm working on a mirror, as well.
Debutante wrote:Ahoy-hoy!!

Glad to report that the bugs of old are gone for me. No more lagging - I've been using it now for about .5 hr and its not slowing anything down - works just fine this 0.2.7 does.
Cpu usage is about 4-5% on my FX-8350.

It's working great!!!!
Good stuff! :)

Post

Thanks for keeping us up-to-date! I love your work. :tu:

Post

Mayae wrote:Hello all, sorry for the silence.

marioisaac wrote:There were some colors that looked great for the Grid Lines, but the dB numbers as you go up in the scale started to fade away until they disappeared about half the way up. Also the frequency tracking information disappeared.
Mayae wrote:That is, when you change the colour?
Hi Mayae, all problems mentioned earlier have dissapeared with the new update. My motherboard wasn't working properly, got that replaced, so that could have been one of the causes.


-I would suggest changing the grid div space scaling. The finest resolution of the scale goes from 3db per line, then it jumps to 5dB. Given that dB values doubles and halves each 6db, it makes more sense to have them scale to multiples of 6.

-Also implementing an option to add a Peak/RMS global meter to the right would be a nice addition. The Peak/RMS could be a sections on it's own in the same way as the (vectorscope, oscilloscope, and spectrum views).

-When selecting the global settings the tab does not give a user a hint on whether he is changing the parameters for the vectorscope, spectrum, or general settings. Now I understand the plugin, but at first sight this was confusing, and I guess for others users will be as well. eg. If I am on the Spectrum settings tab, and I click the Vectorscope tab, the Spectrum header tab turns into black and the Vectorscope header tab turns into the colour of the settings tab, but if I click on the global settings icon, there is no visual feedback (colour change) to indicate I am in a different settings section.

Thank you,

Post

Hi again,
marioisaac wrote:-I would suggest changing the grid div space scaling. The finest resolution of the scale goes from 3db per line, then it jumps to 5dB. Given that dB values doubles and halves each 6db, it makes more sense to have them scale to multiples of 6.
True, this is changed in the next version.
-Also implementing an option to add a Peak/RMS global meter to the right would be a nice addition. The Peak/RMS could be a sections on it's own in the same way as the (vectorscope, oscilloscope, and spectrum views).
The meters would originally be included in the stats page, that's yet to come. Perhaps it would be nice, although compositing of views is deferred to when I make a "sandbox" mode, where you can put multiple views together.
-When selecting the global settings the tab does not give a user a hint on whether he is changing the parameters for the vectorscope, spectrum, or general settings. Now I understand the plugin, but at first sight this was confusing, and I guess for others users will be as well. eg. If I am on the Spectrum settings tab, and I click the Vectorscope tab, the Spectrum header tab turns into black and the Vectorscope header tab turns into the colour of the settings tab, but if I click on the global settings icon, there is no visual feedback (colour change) to indicate I am in a different settings section.
It can be confusing, yes. I'll see if I can figure out a nice solution.

Thanks for the feedback, and I'm happy to hear that (most) of your problems are resolved.

Post Reply

Return to “Effects”